Optimizing The Last Mile
A Comparison of Methodologies for Measuring Transport Distance in Supply Chain Last Mile Delivery
Organization
Client
Kent State University - Graduate School of Business, Department of Management & Information Systems
Research Team
- Alfred Guiffrida: Research Lead
- Victoria Cai (me): Research Assistant
Project Overview
The "last mile" in supply chain management involves the terminating segment of the forward supply chain where products are delivered from the last warehousing location in the supply chain to the customer.
The Last Mile is considered to be one of the most costly (Chopra, 2003) and highest polluting segments (Ülkü, 2012) of the supply chain.
This project evaluates different approaches to supply chain management decision models for evaluating Last Mile cost and carbon footprint.
Published July 16, 2016 Proceedings of 36th International Business Research Conference 14, Ryerson University, Toronto, Canada
Background
Decision models help manage the cost and carbon footprint associated with last mile delivery. A key feature of these decision models is that a proportional relationship exists between the distances that transport trucks must travel in completing last mile deliveries and the cost and carbon emissions resulting from the deliveries. Thus the measurement of transport mileage distance is a critical input to decision models for optimizing the Last Mile. Our research focuses on how travel distances for last mile delivery by transport truck are determined.
Challenge
Logistics systems which were traditionally designed to accommodate batching of multiple products into a single lot delivery from one business to another are now under pressure to deliver high volumes of single parcels from a transportation/warehouse hub to multiple individual customers.
Our task was to contribute to a more efficient methodology for determining delivery mileage inputs for Last Mile decision models.
Research on Decision Model
Into today's competitive marketplace the management of the delivery process is essential for maintaining high levels of customer service (Bushuev and Guiffrida, 2012). From a managerial perspective, understanding the nature of the last mile delivery problem and how it impacts overall supply chain operations is a key management concern.
Goodman (2005) notes that although last mile logistics can account for up to 28% of total transportation costs, many firms treat the Last Mile as an afterthought.
Walker (2006) identifies ten best practices for organizations managing last mile deliveries and provides a framework for lowering costs, simplifying the complexity of deliveries and improving customer service.
Grackin (2014) demonstrates that the last mile delivery costs for a blouse manufactured in Asia and then delivered and sold to a customer in the United States incurs last mile costs ranging from $4-$11.
Millar (2015) comments that in addition to the cost of transportation, last mile home delivery presents additional managerial challenges due to issues such as invalid, incorrect or hard to locate delivery addresses and unaccepted deliveries.
With the global B2C e-commerce market projected to reach $2.3 trillion by 2017, Khanna (2015) notes that resolving last-mile delivery issues will become a major customer service concern for firms.
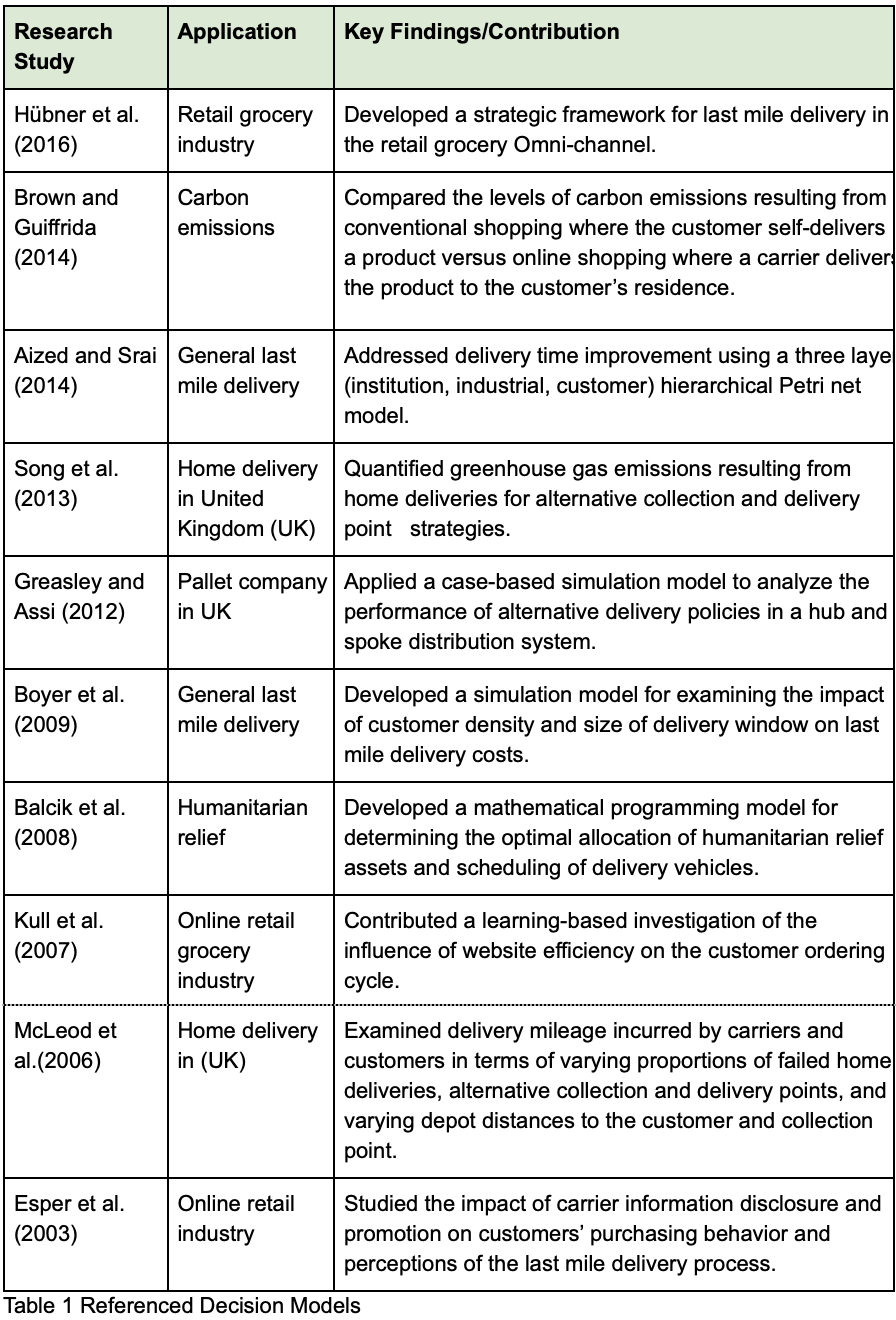
Decision models are built to support supply chain analysts in managing the Last Mile. Models have been developed for a variety of supply chain performance objectives ranging from cost reduction to the efficient delivery of humanitarian aid. Below are a few examples of Last Mile decision models.
In assessing this challenge, I reviewed significant decision models across Last Mile and related domains. The complete list and key findings are in Table 1 as above.
Alternative Estimation Methodologies
The origin-to-destination delivery mileage distance is a key input in many Last Mile decision models. The cost and carbon emissions resulting from the delivery process are a direct function of the delivery travel distance. The mileage distance for origin-to-destination deliveries can be determined using a variety of web-based mileage calculators such as Google Maps, Travelmath, WorldAtlas, or MapQuest.
By inputting city name, street address or zip code information, the delivery mileage distance between an origin and destination can be found.
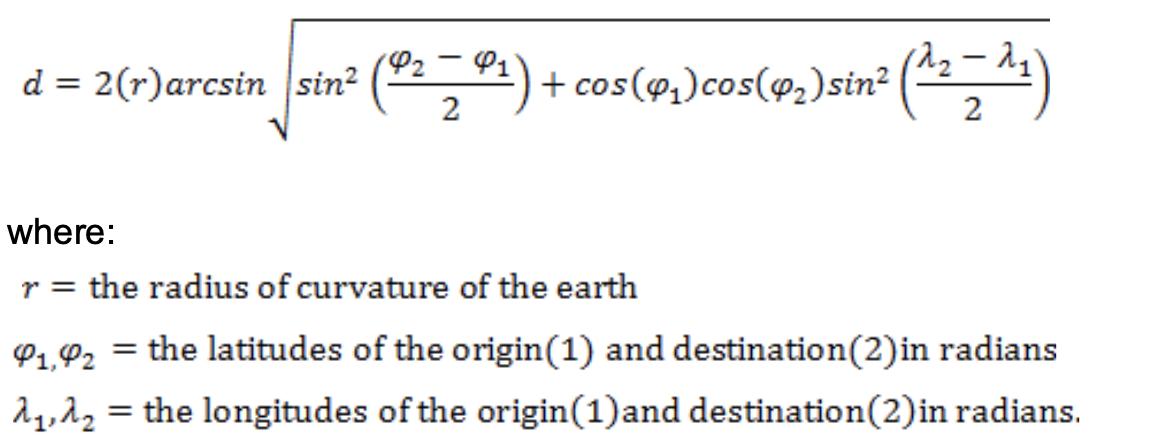
An alternative method for determining mileage distance involves approximating the distance using the Haversine formula (above image).
The Haversine formula, which is a special case of the general Law of Haversines which relates the sides and angles of spherical triangles, can be used to estimate the distance between an origin and destination based on their longitudes and latitudes. The approximate distance, d, between an origin and destination can be found by evaluating the Haversine formula.
An approximation of the distance mileage between an origin and destination can be computed using an online Haversine calculator. In the next section a case study is used to analyze the error between approximated mileage distances as calculated by the Haversine formula and true mileage distances as found by Google Maps.
Case Study
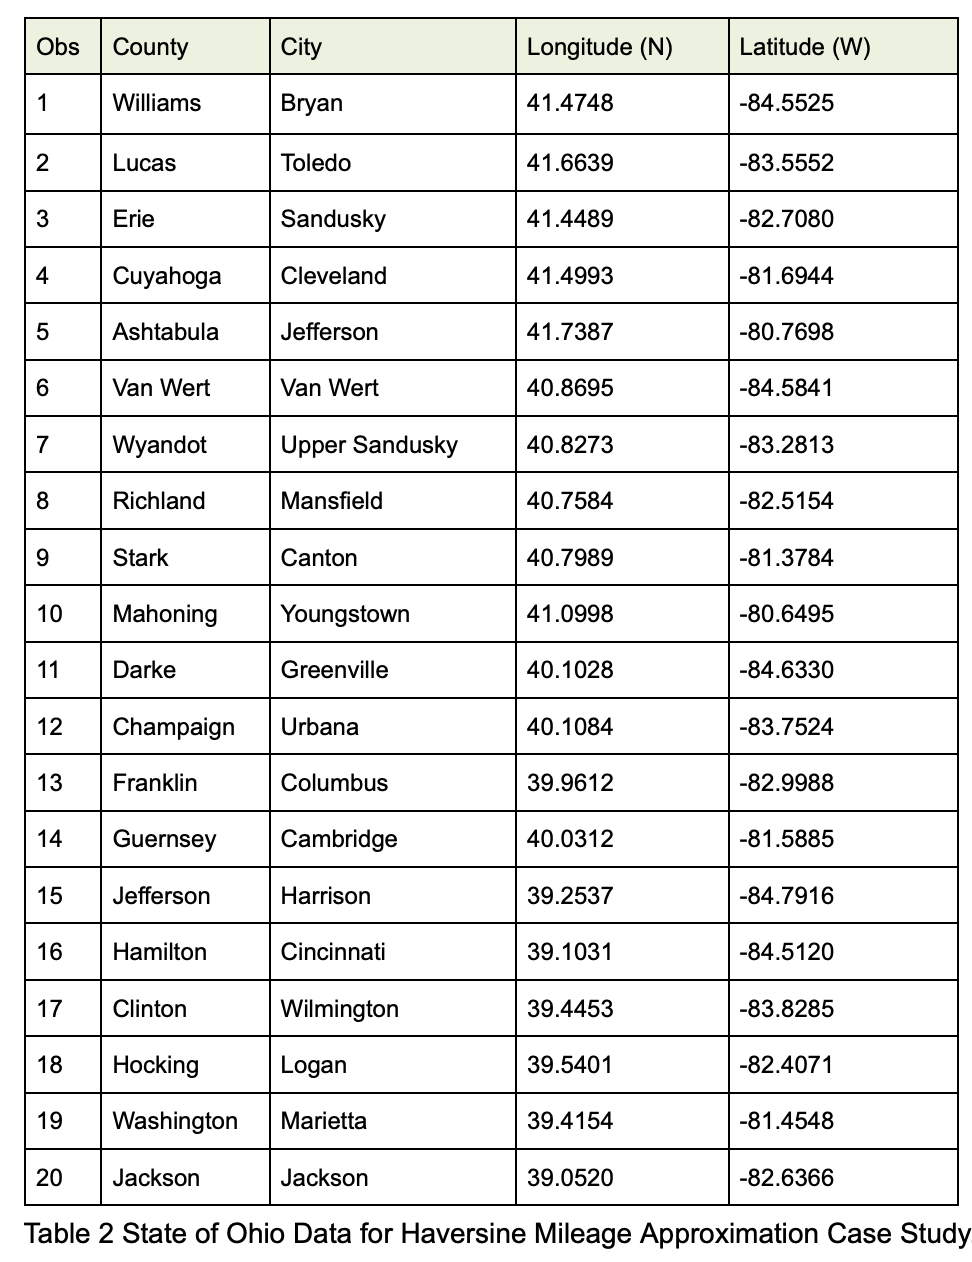
The state of Ohio is located in the Midwest region of the United States and is subdivided into 88 counties with 251 cities. Using this sample frame, a non-probability sample of 20 counties was selected. One city was then selected from each of the 20 counties to define a twenty by twenty origin-to-destination matrix of cities. The procedure used to select the counties and cities involved superimposing a grid of five horizontal and four vertical lines onto a map of the state of Ohio.
Given the rectangular shape of the state of Ohio, the intersections of the grid lines identified 20 counties which reasonably represented the geographic layout of the state. The closest city to each grid intersection point was then selected for the study. The longitude and latitude information for each city defined the origin-to-destination matrix was used in the Haversine mileage estimates (see Table 2).
When the twenty cities identified in Table 2 are assembled into a 20 row by 20 column origin-to-destination matrix there are 190 distinct origin to destination delivery route combinations. The percentage error (PE) resulting from the Haversine approximations of the true mileages of the 190 origin-destination delivery routes was calculated as follows:
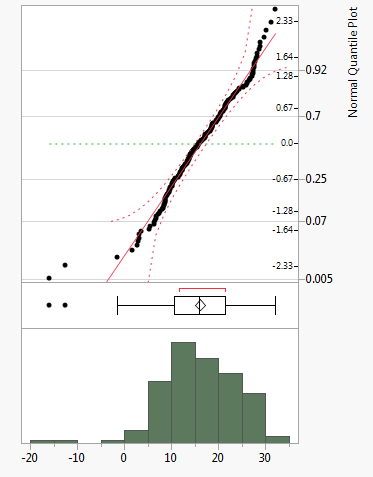
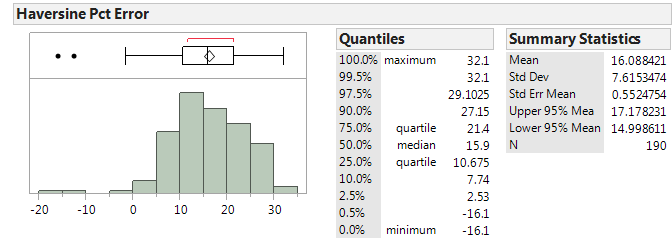
PE = 100%[(true mileage – approximated mileage)/(true mileage)]The PE data is summarized in Figure 1. Figure 2 provides a normal quantile plot of the PE data.
 (click to expand) collapse
Examining Figure 1 we observe that for the case study data, using Haversine formula to approximate mileage distances between the 190 origin and destination combinations resulted in an average percentage error of 16.1% with a standard deviation of 7.6%. As illustrated by the interquartile range, half of the 190 errors were within the range of 10.7% to 21.4%.
The Haversine approximation predominately understated the true mileage distance in 187 of 190 error comparisons. The median percentage error of 15.9% relative to the average percentage error of 16.1% indicates that the shape of the percentage error distribution was close to symmetric.
The normal quantile plot of the PE data shown in Figure 2 suggests that the normal distribution is a reasonable probability model to describe the percentage error data in this case study.
Summary and Conclusions
Determining last mile delivery mileage distances using web-based (or in-house purchased or leased) mileage calculator requires the user to enter each city name, street address, or zip code for all origin and destination combinations. When the number of origins and destinations becomes large the number data entries required to determine the delivery mileage increases at a nearly exponential rate
Our data-driven method is cost-efficient.
To circumvent this burden, we examined estimating the mileage distances between origins and destinations using longitude and latitude data and then estimating the mileage using Haversine formula. Longitude and latitude data for cities (or zip codes) for vast geographic regions can be downloaded from the Internet in a single keystroke. Also, these longitude and latitude data can be downloaded at no cost thus avoiding any investment cost required to purchase or lease and maintain proprietary mileage distance calculators.
Our estimate method has a relatively high error bound.
When implemented in a spreadsheet environment, the Haversine approximation methodology demonstrated in this paper eliminates the need to enter city names, individual addresses or zip code information thus contributing to a more efficient methodology for determining delivery mileage inputs for Last Mile decision models.
For the state of Ohio case study, the Haversine approximation had a relatively large average percentage error of 16.1% and underestimated the true mileage distance for nearly all origin and destination combinations.
Error-correction or data modifier can be further applied to our results.
Since delivery costs and carbon emissions are proportional to the delivery mileage distance traveled by a transport truck, many analysts may find this magnitude of error unacceptable and tend not to use the Haversine formula to determine mileage estimates for Last Mile decision models.
Future research can be conducted to provide an error correction and bounding information which can be applied to last mile delivery mileage estimates generated by the Haversine formula.
Using the error correction and bounding information may allow the analyst to take advantage of the benefits of reduced data entry and software investment cost that the Haversine distance mileage approximation methodology affords.
References
- Aized, T. and Srai, J.S. (2014)
Hierarchical modelling of last mile logistic distribution system, The International Journal of Advanced Manufacturing Technology, Vol. 70, No. 5-8, pp.1053-1061. - Alfalla-Luque, R., Marin-Garcia, J. A. and Medina-Lopez, C. (2015)
An analysis of the direct and mediated effects of employee commitment and supply chain integration on organisational performance, International Journal of Production Economics, Vol. 162, pp. 242-257. - Balcik, B. and Beamon, B. M. (2008)
Facility location in humanitarian relief, International Journal of Logistics, Vol. 11, No. 2, pp.101-121 - Boyer, K. K., Prud'homme, A. M. and Chung, W. (2009)
The last mile challenge: Evaluating the effects of customer density and delivery window patterns, Journal of Business Logistics, Vol. 30, No. 1, pp. 185-20 - Brown, J. R. and Guiffrida, A. L. (2014)
Carbon emissions comparison of last mile delivery versus customer pick up, International Journal of Logistics and Applications, Vol. 16, No. 6, pp. 503-52 - Bushuev, M. A. and Guiffrida, A.L. (2012)
Optimal position of supply chain delivery window: Concepts and general conditions, International Journal of Production Economics, Vol. 137, No. 2, pp.226-234. - Chopra, S. (2003)
Designing the distribution network in a supply chain, Transportation Research, Vol. 39, No. 2, pp. 123-140. - Esper, T. L., Jensen, T. D. and Turnipseed, F. L. (2003)
The last mile: an examination of the effects of online retail delivery strategies on consumers, Journal of Business Logistics, Vol. 24, No. 2, pp.177-20 - Goodman, R. W. (2005)
Whatever you call it, just don't think of last-mile logistics last. Global Logistics and Supply Chain Strategies, Vol. 9, No. 12, pp. 46- - Grackin, A. (2014)
The year of the last mile - Greasley, A. and Assi, A. (2012)
Improving 'last mile' delivery performance to retailers in hub and spoke distribution systems, Journal of Manufacturing Technology Management, Vol. 23, No. 6, pp. 794-805. - Hübner, A., Kuhn, H. and Wollenburg, J. (2016)
Last mile fulfilment and distribution in Omni-channel grocery retailing: A strategic planning framework, International Journal of Retail & Distribution Management, Vol. 44, No. 3, 228-24 - Khanna, K. (2015)
Perfecting last mile delivery process in E-commerce logistics - Kull, T. J., Boyer, K. and Calantone, R. (2007)
Last-mile supply chain efficiency: An analysis of learning curves in online ordering, International Journal of Operations & Production Management, Vol. 27, No. 4, pp. 409-434. - Leuschner, R., Rogers, D. S. and Charvet, F. F. (2013)
A meta-analysis of supply chain integration and firm performance, Journal of Supply Chain Management, Vol. 49, No. 2, pp. 34-57. - McLeod, F., Cherrett, T. and Song, L. (2006)
Transport impacts of local collection/delivery points, International Journal of Logistics, Vol. 9, No. 3, pp.307-317. - Millar, M. (2015)
Challengers of last mile delivery in serving E-commerce business - Ralston, P. M., Blackhurst, J., Cantor, D. E., and Crum, M. R. (2015)
A structure–conduct–performance perspective of how strategic supply chain integration affects firm performance, Journal of Supply Chain Management, Vol. 51, No. 2, pp. 47-64. - Song, L., Guan, W., Cherrett, T. and Baowen, L. (2013)
Quantifying the greenhouse gas emissions of local collection-and-delivery points for last-mile deliveries, Transportation Research Record: Journal of the Transportation Research Board, No. 2340, pp. 66-73. - Ülkü, M. A. (2012)
Dare to care: shipment consolidation reduces not only cost, but also environmental damage, International Journal of Production Economics, Vol. 139, No. 2, pp. 438-446. - Walker, A. (2006)
The Last mile is the longest mile, Supply Chain and Demand Chain Executive, June/July, pp. 40-43. - Haversine formula
- Example Haversine Calculator